Objectives
The Residential Building Systems (RBS) group collects residential data from diagnostics tests to characterize the energy use and indoor air quality of the U.S. housing stock.
Our goal is to compile a national database that contains measurements of air leakage, ventilation, and indoor air contaminants.
RBS has updated the residential diagnostics database several times since its start in mid 1990s. Houses in the U.S. are ventilated primarily through leaks in the building envelope.
Air tightness of the building envelope is an important factor that affects energy use, as leaky homes require more energy for heating and cooling to maintain thermal comfort.
On the other hand, new homes rated for energy efficiency (e.g.,
ENERGY STAR certified new home) often follow
the strategy of “Building Tight, Ventilation Right”. Air tightness data can be used to characterize the construction
quality of the building envelope. This data is also useful to assess if the combination of mechanical ventilation and infiltration is adequate to maintain acceptable indoor air quality.
Currently, the Residential Diagnostics Database (ResDB) contains building envelope air leakage data from about 147,000 homes, and duct leakage data from 18,700 homes.
In 2011, we gathered a large amount of data from across the country to improve geographical coverage of the database. Weatherization assistance programs,
residential energy efficiency programs, and energy ratings of new homes are the main sources of data.
We have extended the database beyond just air leakage data, but to also include ventilation and indoor air contaminants data. The consolidation of these different types of data into
a database will support analysis to study their interdependent relationships. For example, the data gathered here will be utilized by RESAVE, a CEC-funded research program,
which aims to reduce peak load and energy costs related to ventilation and infiltration. The analysis will also be utilized by Home Energy Saver to recommend energy saving measures to U.S. homes.
Envelope Leakage
Building envelope air leakage data is available from 147,000 U.S. homes, including single-family detached and attached homes, multi-family homes, and manufactured homes.
Number of Homes with Building Envelope Air Leakage Data in ResDB
Count as of January 2012. Number of homes includes single-family, multi-family, and manufactured homes
Normalized Leakage of U.S. Homes
Normalized leakage (NL) is the measure of air leakage used in ResDB. Roughly speaking,
NL = 0.55 corresponds to ACH50 = 10 (i.e. 10 air changes per hour at a pressure difference of 50 Pa).
|
Home Counts |
NL Geometric Mean |
NL Geometric Standard Deviation |
| Single-Family Detached Homes |
135,600 |
0.61 |
2.5 |
| Single-Family Attached Homes |
15,000 |
0.79 |
1.8 |
| Multi-Family Homes |
2,000 |
0.43 |
1.8 |
| Manufactured Homes |
8,200 |
0.94 |
1.7 |
LBNL preformed multivariate regression (see “Model”) to analyze the relationship between NL and various housing characteristics. The model considers single-family detached homes only.
Summary of Findings
- Multivariate regression (click on "Calculator") explains 68% of the observed variability in the NL of single-family detached homes.
- The model suggests that NL varied by a factor of 2.6 for homes that are located in different IECC climate zones.
- Homes in California that are located in difference California climate zones differ by 20% in NL.
- Homes that are built prior to 1960's tend to have NL twice the value as homes that are built in 2000's.
- California homes show more rapid improvements in airtightness over the same time period.
- Homes rated for energy efficiency tend to have NL 30% lower than typical homes.
- Before weatherization, homes that participated in weatherization assistance programs (WAPs) tend to have NL 50% higher than typical homes.
- The median reduction in NL from retrofit is 30% for WAPs, and 20% for other residential energy efficiency programs.
LBNL analyzed the air leakage measurements from 134,000 single-family detached homes in the US.
This calculator computes the expected air leakage distribution for homes with selected characteristics.
The predictions are based on results from the multivariate regression.
Floor Area (sqft)
Ceiling Height (ft)
(calculation assumes house height = ceiling height + 2 ft)
Year Built
Weatherization Assistance Program (WAP) qualified?
Home rated for energy efficiency
(e.g. ENERGY STAR certified home)?
Region
Climate zone
See IECC climate zone
map;
also
residential energy code requirements
Foundation Type
Duct System Location
$cmd
";
// if ($_GET['run_env_model'] == "1") {
// run_env_model();
// }
?>
This is a California-specific model develoepd based on an analysis of 4,500 homes from the state.
It predicts the air leakage distirbution for single-family detached homes located in the difference climate zones of California.
There are 16 California Building Zones; see
http://www.energy.ca.gov/maps/renewable/building_climate_zones.html
The model uses an approximate definition of climate zones based on county lines. All but zones 1, 5, and 15 are represented in the model.
Climate zones where homes have similar air leakage values are grouped together. This gives 7 categories: (a) to (g), from the least to most leaky, in the regression model.
Floor Area (sqft)
Ceiling Height (ft)
(calculation assumes house height = ceiling height + 2 ft)
Year Built
Weatherization Assistance Program (WAP) qualified?
Home rated for energy efficiency
(e.g. ENERGY STAR certified home)?
Climate zone
(see figure)
Foundation Type
Duct System Location
$cmd
";
// if ($_GET['run_env_model'] == "1") {
// run_env_model();
// }
?>
Duct Leakage
Duct leakage measurements are available from 28,000 homes and 28 states. The majority of the data are from single-family detached homes.
Number of Homes with Duct Leakage Data in ResDB
| States |
Number of homes |
| California |
11,200 |
| Texas |
6,800 |
| Washington |
6,500 |
| Florida |
2,000 |
| Nevada |
700 |
| New Mexico |
300 |
| Arizona |
200 |
| Illinois |
100 |
| Minnesota |
100 |
| 19 Other States |
100 |
Duct Leakage Measurements of U.S. Homes
Preliminary Findings
|
Average Estimates |
| Percent of duct leakage to duct system air flow |
18% |
| Ratio of duct-leakage-to-outside to total-duct-leakage |
0.4 |
| Percent reduction in duct leakage from retrofit |
35% |
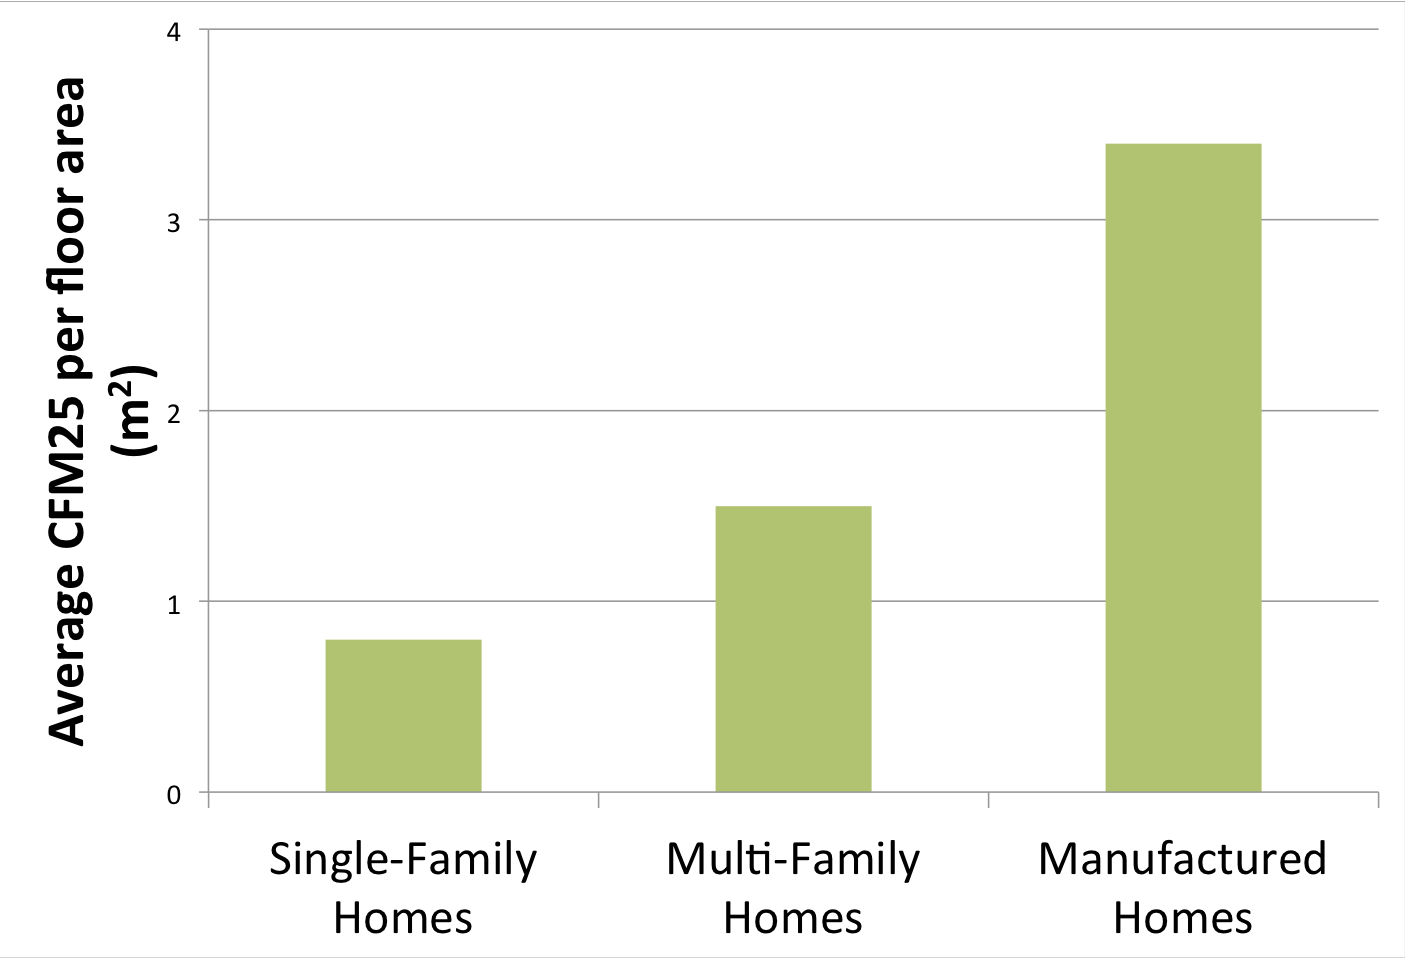
LBNL collected duct leakage measurements from 28,000 homes. Duct leakage is measured in units of cfm25 (i.e., cubic feet per minute of air leakage from the duct system at 25 Pa pressure difference).
The histogram shows duct leakage measurements from homes with different characteristics.

Summary
| Number of Homes |
13,567 |
| Mean Duct Leakage |
119 cfm25 |
| 0.88 cfm25 per floor area (m2) |
Note that the summary statistics presented here are preliminary results. All homes with the selected characteristics are included in the histogram;
it does not adjust for other characteristics. Consequently, the data may not be statistically representative for the US. Almost all of them are from single-family detached houses.
Summary
|
Pre-retrofit |
Post-retrofit |
| Number of Homes |
474 |
474 |
| Mean Duct Leakage |
339 |
176 |
Note that the summary statistics presented here are preliminary results. All homes with the selected characteristics are included in the histogram;
it does not adjust for other characteristics. Consequently, the data may not be statistically representative for the US. Almost all of them are from single-family detached houses.
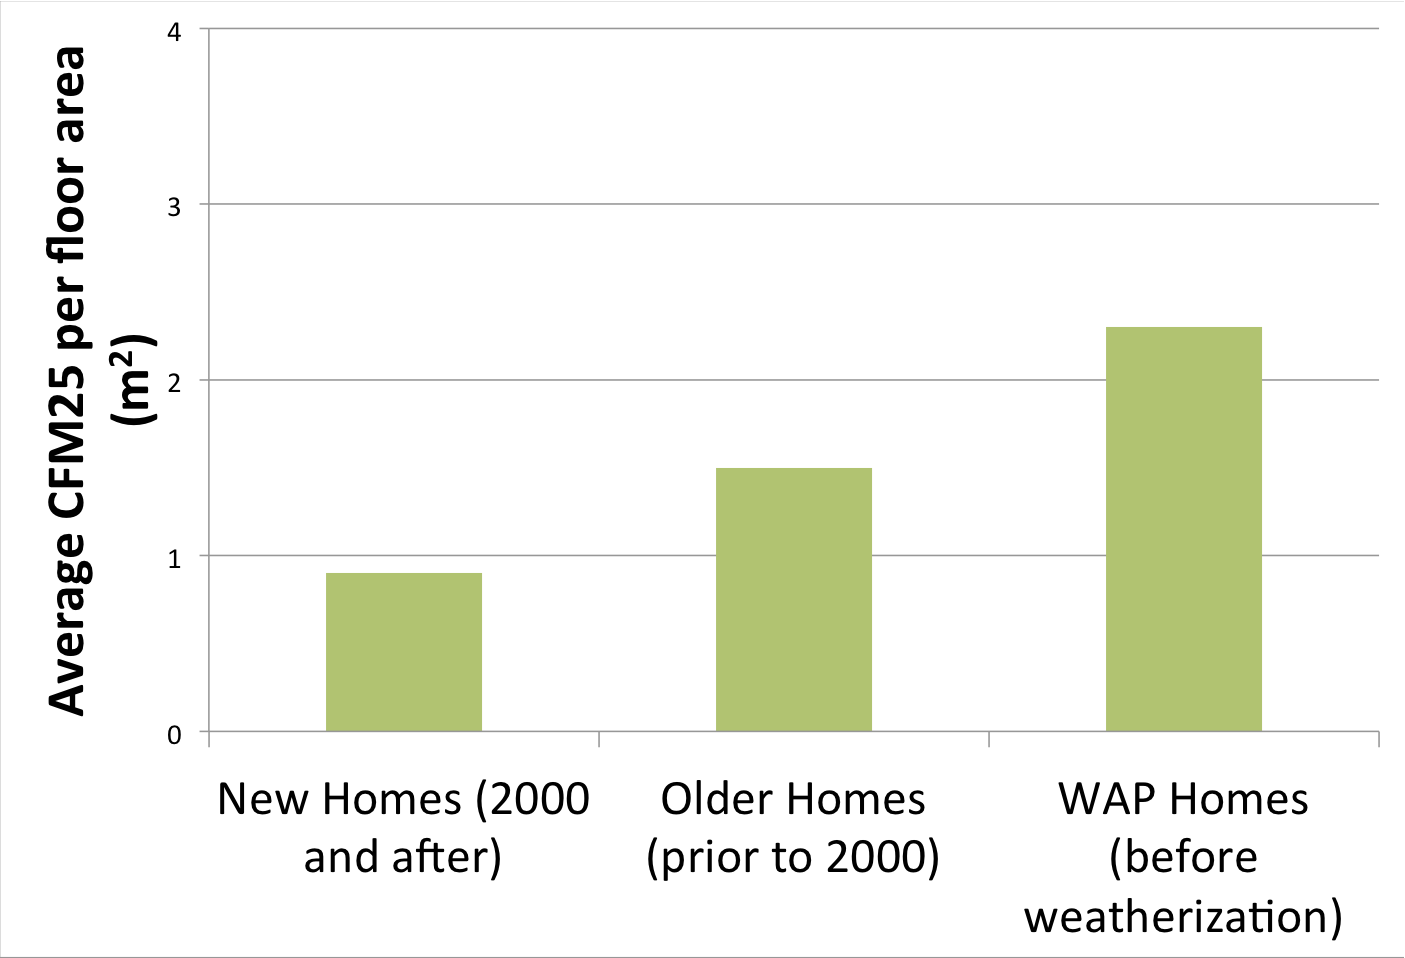
|
WAP |
non-WAP |
| Number of Homes |
928 |
13,567 |
| Mean Duct Leakage |
cfm25 |
243 |
119 |
| cfm25 per floor area (m2) |
2.3 |
0.88 |
|
Pre-retrofit |
Post-retrofit |
| Number of Homes |
474 |
| Mean Duct Leakage (cfm25) |
339 |
176 |
Contact Us
Project Team
Iain Walker
Staff Scientist
Residential Building Systems Group
Rengie Chan
Research Scientist
Indoor Environment Group
Acknowledgements
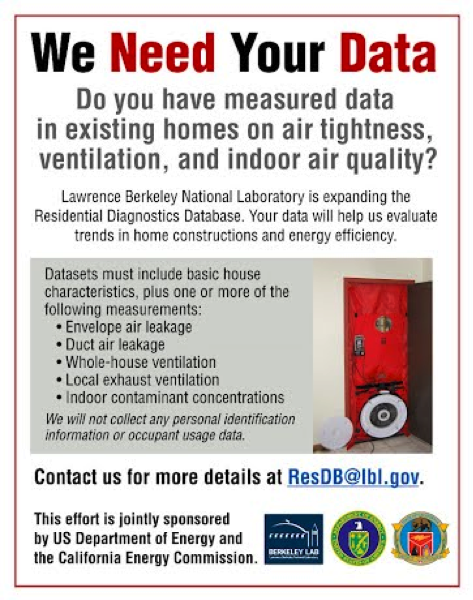
We greatly appreciate the organizations and individuals who shared their blower door measurements and other diagnostic data with us. Thank you!
We would also like to thank the following organizations for posting our call for data announcement.
- RESNET
- ACI
- Home Energy Magazine
Thanks you for all your help!
This work is jointly sponsored by the Building Technologies Program of the US Department of Energy and the California Energy Commission Public Interest Energy Research Program.
Data have been provided to us by (partial list):
- Alaska Housing Finance Corporation
- Community Action Partnership Association of Idaho
- Community Housing Partners Corporation (Virginia), Energy Services Division
- Crawford-Sebastian Community Development Council, Inc.
- Energy Center of Wisconsin
- Florida Department of Community Affairs
- Kristen Simmons Architects
- Minnesota Center for Energy and Environment
- Montana Department of Public Health and Human Services
- New Jersey Board of Public Utilities, Clean Energy Program
- North Carolina Advanced Energy
- North Coast Energy Services
- North Dakota Department of Commerce, Weatherization Program
- Northwest Energy Efficiency Alliance
- Oak Ridge National Laboratory
- Ohio Department of Development
- Peregrine Energy Solutions
- Salt Lake Community Action Program
- Washington State University Extension Energy Program
and various other public and private organizations.